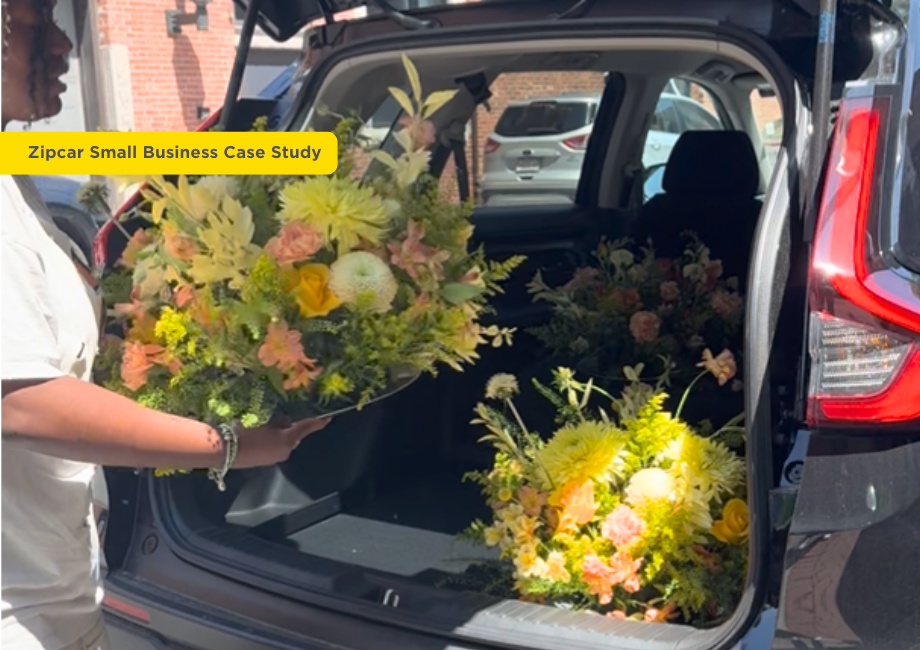
For 25 years, Zipcar has helped small businesses get where they need to go. Anthomanic Floral Company relies on Zipcar to pick up fresh flowers, transport breathtaking bouquets, and deliver one-of-a-kind designs across Boston.
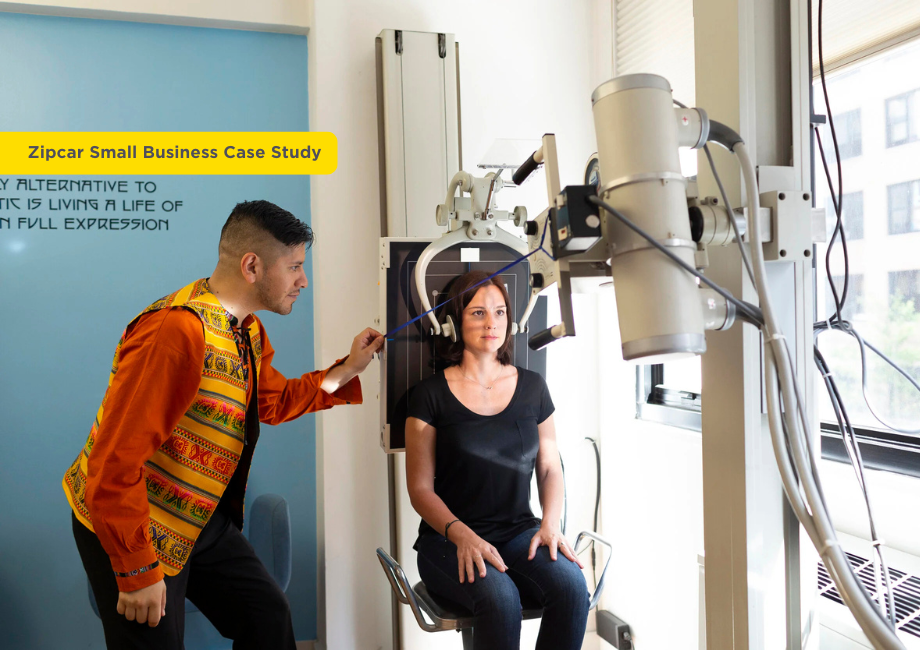
For 25 years, Zipcar has helped small businesses get where they need to go. AMAYU Institute uses Zipcar to expand its service area and connect with patients across NYC.
Unlike other Uber car rentals, Zipcar has a daily rental rate. See why it helps you focus on driving and earning.
Car sharing helps students—and parents—get the most out of college.
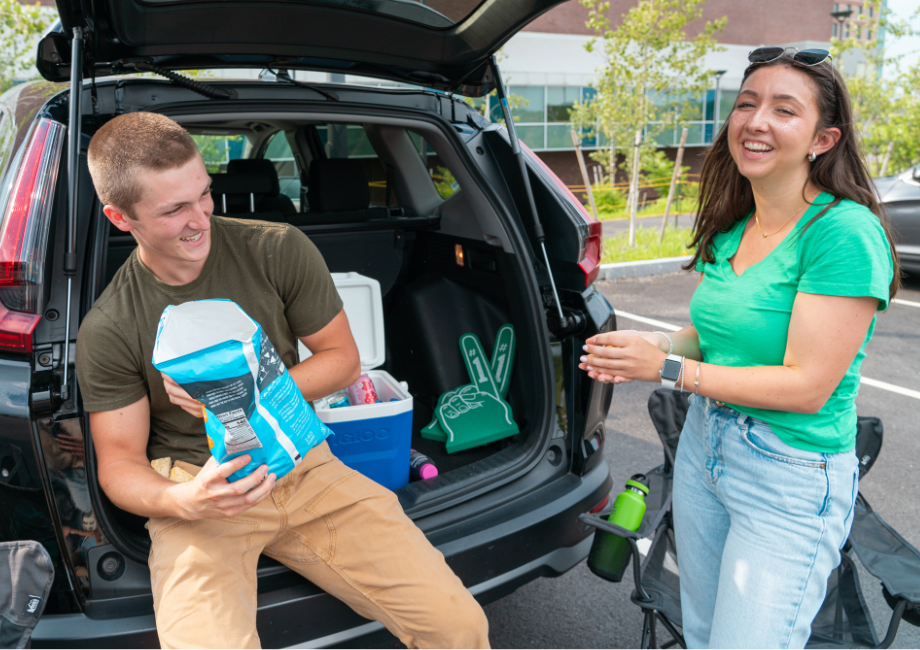
Zipcar is having a car on campus without the headaches of owning one.
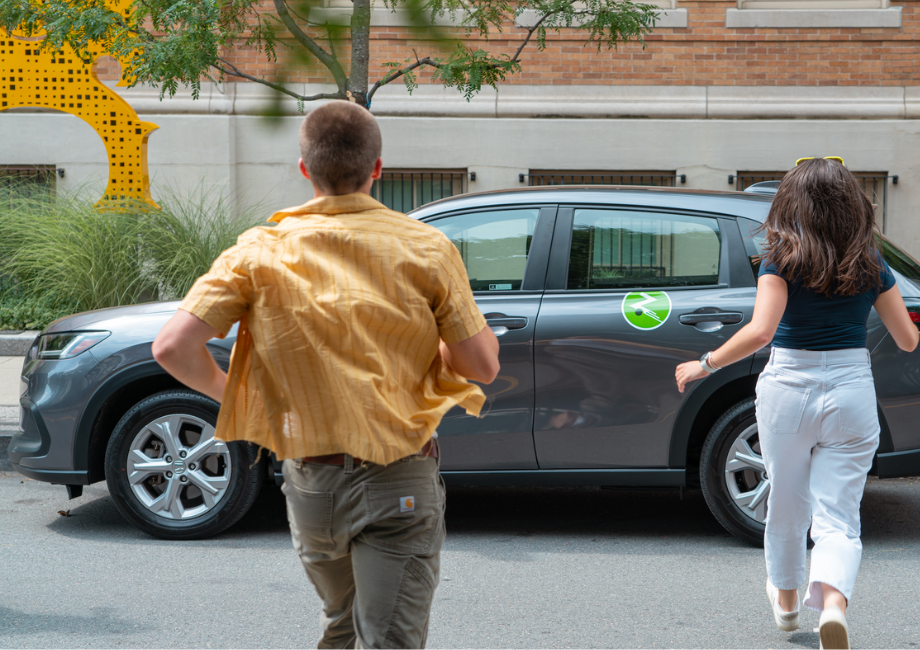
Still on your provisional license? No problem. Zipcar gives you an easy way to get around your college town.
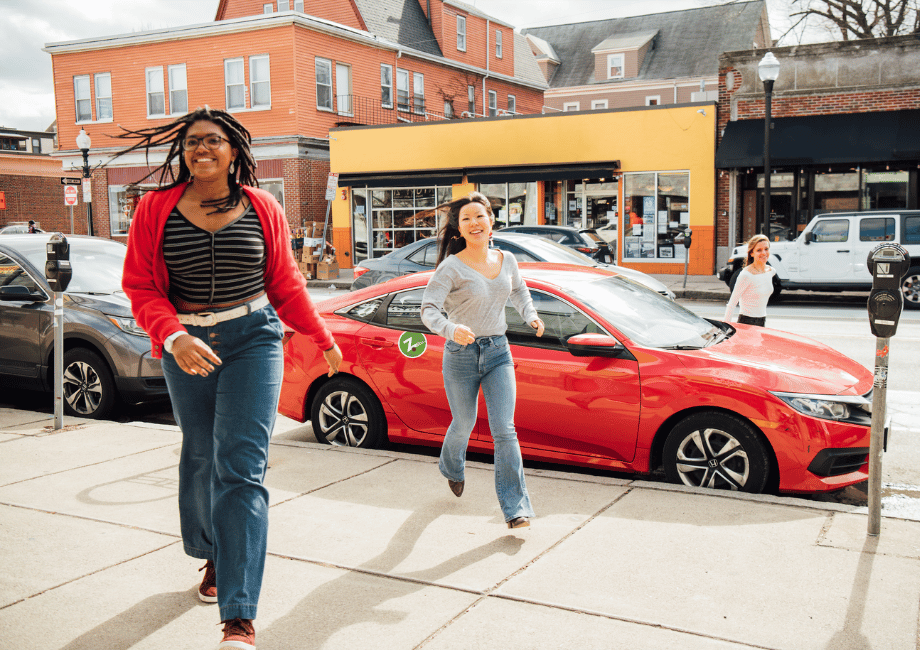
Getting around as an international student is easier than you think.